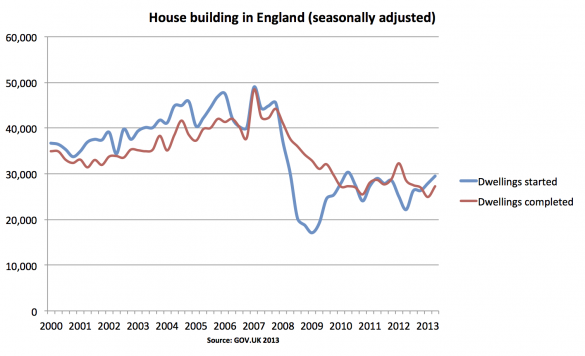
There’s been a lot of discussion today about the housing shortfall in the UK, and in particular whether the restrictions of the planning system or the cap on councils’ housing spending is to blame. Whatever lies behind the low present rate of house building – and there are a range of possible explanations, including the shape of the mortgage market and the economy more broadly – it’s clear that the rate at which we’re building new homes in England has some way to go until it returns to pre-crash levels:
It’s difficult to calculate exactly how many new houses we need to build. Firstly, on the supply side, homes can be created by renovating existing, empty properties – not just by building new ones. Secondly, on the demand side, housing need isn’t just embodied by those who are homeless but by those living in overcrowded homes, temporary accommodation or in housing which is unfit for habitation. While in the private market, housing need doesn’t always become apparent until individuals or households decide to try and buy or rent a new property, in the social rented sector there is a definite number attached to the shortfall between housing demand and supply: the housing waiting list.
The map below shows the extent of the housing waiting list in each of the 364 local authorities in England, according to the latest data which dates from April 2012.
[iframe src=”https://www.google.com/fusiontables/embedviz?q=select+col20+from+1in7tKDiZnyUDPRbETCytGMIxQx5w21MjtEWZ3io&viz=MAP&h=false&lat=51.53944997791739&lng=-0.7954813719505864&t=1&z=8&l=col20″ width=”100%” height=”440″]
Unsurprisingly there’s a lot of variation, with waiting lists ranging from below 100 to the tens of thousands. This is because the numbers are counts rather than proportions, and some authorities have much larger populations than others. However, there’s a power to keeping the data in this form, as raw numbers: if you’ve never looked at the housing waiting list before it’s quite staggering just how large it is, and how quickly it’s growing. Ten years ago there were just under 1.1 million people in the queue; today that figure has risen to over 1.8 million. In metropolitan authorities such as Sheffield, where the housing waiting list is over 68,000, the extent of housing need is astounding.
